Note: If you want to get stuck into the code implementation, skip to the first horizontal line. This post is pretty long as I wanted to provide proper documentation on how it works, without having multiple documents covering the same topic.
Around mid-2016, my parents had solar panels installed. Along with the solar panels, they obviously got an inverter, and also purchased a “smart meter”, which is able to measure energy throughput to and from the grid.
My father being an ex-process and systems engineer, decided on using a system from Fronius as it was commercial/industrial quality equipment (at least from information available), and so would be built to last and perform.

The systems engineer in my father loves to collect data. He rarely however, actually does anything with said data because its too hard to compile into a format that is useful.
This is where this project comes in. This project is about collecting data from the solar inverter and feed-in power meter, and put the data into a database, so it can later be viewed from a webpage. It collects daily values, and some basic statistics on daily figures. The web viewer is going to be written up in a secondary post.
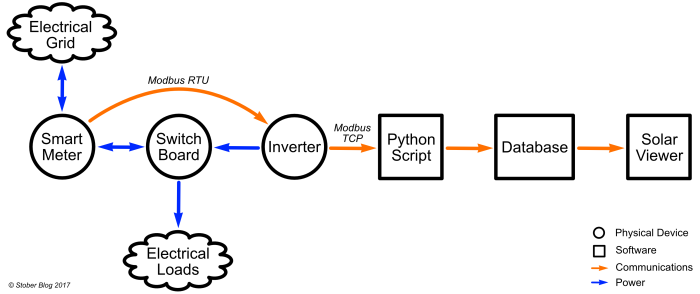
So how am I extracting the data from the devices? Well thankfully, there is a standard specification for communicating with solar power inverters and smart meters. Its called SunSpec and works not just on Fronius devices but other manufacturers too. This standard uses Modbus, which is a generic industrial communication protocol, that is physically either on top of RS485 (aka RTU) or TCP Ethernet.
Fronius (and presumably other manufacturers) offer data logging solutions themselves, so why on earth would I make my own data logging solution? Well Fronius offer two solutions to get data.
The first is a basic FTP or HTTP post method. This has two major drawbacks
- it only uploads once a day, and if that fails for any reason, you lose the entire day’s worth of data.
- Secondly, you only get a subset of data, for example no ability to use an arbitrary sampling rate.
The other option is SolarWeb. This is what we have been using over the last year. This seems nice on first inspection, with basic plots of energy production and energy to and from the grid. You can even setup daily, weekly or monthly reports to be sent via email to you.

SolarWeb Front Page

SolarWeb Plot
However, once you try analyse data, it becomes less friendly.
- The plots shown, can only show a particular day, month or year (i.e. no last 24 hours over multiple days, or show multiple sequential days for instance).
- The plots are also horribly coloured (shaded in), which means they are hard to read.
- There is a bug on the inverter, where after approximately a month, the inverter stops uploading data, and the datalogger on the inverter needs to be restarted.
- Finally, the developers over the last 3 months have been treating the production site as a testbed for code it seams, with the site frequently down, not sending out correct data, or just not displaying properly.
Solarweb also has “features” which seem to have been added simply to give the illusion of complexity or to take up space:
- There are useless/out of place plots such as one designed for multi-inverter use, which shows percentage of maximum output but it looks very strange with a single bar for the percentage.
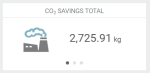
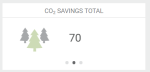
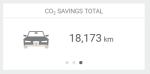
- There is misleading CO2 emissions saved in number form, trees and distance driven. This is mostly misleading as CO2-emitted/kWh is highly variable on the power grid generation source For example, in Australia in 2008, Victoria had an emissions factor of 1.09CO2-e/KWh compared to Tasmania with 0.12CO2-e/KWh (ref National Greenhouse Accounts Factors, table 5, page 19). I calculated what SolarWeb were using and it was approximately 0.51Co2-e/KWh. Trees and vehicles also absorb/produce varying amounts of CO2.
So rather than just complain about Solarweb, I decided to make my own datalogger service alternative.
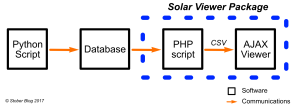
The datalogger software solution I’ve developed, is a combination of three distinct parts. These are:
- An acquisition/python script that polls the Solar Inverter via Modbus for the desired electrical properties. The script then stores the acquired data on a database.
- The Database which stores all the data.
- A Web viewer.
The python script is the main subject of this post, with a follow up post about the web viewer. The viewer is actually the most interesting part, and the direct replacement with SolarWeb.
The acquisition script is written in python. This is for a few reasons:
- I wanted the outcome of the project, so I didn’t want to relearn the wheel. As such, python gave the right level of abstraction for quick development. Including ease to communicate to databases, and via Modbus, while still giving me the ability for data manipulation (more on this later).
- Its multiplatform, so I can develop and test the code on my Windows PCs, and then when ready upload to a Linux server.
- I use python at work, and so no need to learn from scratch.
The previous summery of what the script does (poll data and save), sounds very simple, but to implement, a number of extra components are required.
The first of these is a scheduler, so the script doesn’t take up excessive amounts of CPU time, and memory. This could be skipped, if I was to use cron (Linux, Mac) or Windows Task Scheduler, but by implementing in the script, its simple to change platform, and the inverter local time can be used if desired instead. Much like SolarWeb, there is (multi-)minute interval and daily datasets (albeit an arbitrary value can be used rather than predefined). The implementation, while in my opinion is crude, is also intelligent enough that it can’t under sample, only over sample (such as when NTP changes local time).
Bitwise data manipulation is also implemented. This allows the 16bit Modbus registers to be, if required, stitched together (32bit or 64bit), allow conversion between signed and unsigned integers or conversion to and from floating point numbers. Implementation wise, this uses the c types modules allowing unions and specific variable types to be defined.
Other useful features include
- Logging of events in the script, such as errors, and general messages. These are stored in the same database as the data itself. Different log levels can be used.
- Ability to use a power/smart meter. Currently, only a single phase meter (as sunspec meter 1) is implemented.
- The ability to disable the readings from the smart meter. All values in the database get set to zero if this is used. To be honest, if you don’t have a smart meter, get one, as solar production values themselves are IMO, a bit useless if you don’t know how much power/energy you’re using.
- Graceful shutdown. In the event of the computer being shutdown while the script is reading, it will finish reading then exit.
The script compiles two sets of data. The first is interval/periodic data. This can be configured to be in multiples of single minutes, starting at one minute. At each sample, the following is collected:
- Power being produced by the inverter [W];
- Power passing through the feed-in point/smart meter [W];
- Voltage at the feed-in point/smart meter [V];
- Current being pushed out by the inverter [A];
- Power Factor at the inverter;
- Power Factor at the feed-in point/smart meter;
- DC Voltage of the first Solar Panel String [V];
- DC Voltage of the second Solar Panel String [V];
- Total energy produced by the Inverter [Wh];
- Total energy exported to the grid [Wh];
- Total energy imported from the grid [Wh]
The other date type is daily. This is compiled after the last periodic reading for the day. The values collected are:
- Maximum power production for the day [W];
- Energy produced that day [Wh];
- First occurrence for the day of production over a certain threshold [time] ;
- Last occurrence for the day of production over a certain threshold [time];
- A percentage of time between those thresholds that the system was exporting;
- Total energy produced by the Inverter [Wh];
- Total energy exported to the grid [Wh];
- Total energy imported from the grid [Wh]
I set the thresholds to be 5W (with our maximum being around 4500W), so the data I get, gives me the days operating times. I’m hoping once I get more data, to be able to get an indication of how operating time varies throughout the year and how that compares to other data such as operating time vs energy produced in that time.
The script collects the data types that I feel are beneficial to keep, however it’s relatively easy to modify. The script is relatively well documented, on how it works (and I keep adding more comments as I do more, or when I go over parts I’ve since forgotten how they work). I’ll most likely decide I want to add data in the future, so when that time comes, I’ll add a post.
I didn’t want to store unnecessary data, as its simply more used storage, and it takes longer to download off the inverter. I also didn’t make these extra fields configurable, as the database tables would need to be modified for each new column. If however you would like to add extra data, there are a heap of extra Sunspec/Modbus commands implemented. If you want three phase, I haven’t added those, but are easy to implement. I got the sunspec Modbus registers from Fronius (From here, you need to register however), but there are plenty of other websites that give SunSpec details. For those wondering why I didn’t use pysunspec, the official python module, it seemed overly complex, and at first glance didn’t have TCP support (which I now realise it does).
I’ve uploaded the scripts to Github – https://github.com/stoberblog/sunspec-modbus. To use them, there is a relatively simple setup.
The requirements for use are:
- Python 3.4 or later (v3.4 is required for enumerated types)
- pymodbusTCP
- mysql-connector-python
- MariaDB
A readme is provided on how to install the two python modules, and a separate file contains the MariaDB SQL commands to create and initialise the database.
I’m currently directly communicating to MariaDB, but in the future I’m hoping to change this to use a more generic method by using SQLAlchemy, as I had some problems with direct communication.
The script has a configuration file which allows setup of the inverter address, Modbus port (see below), database settings, and the time between periodic readings. There are also a few other minor settings.
To have the script auto-start on boot on my linux server (CentOS 7), I used a systemd script. To make this I followed the instructions here. If I notice in the future, they are unavailable, I’ll write a post to replace the link.
To setup the inverter to allow modbus connection is similarly easy. Log onto the device, using its IP address, with an admin or service accounts (I don’t think the “user” account has privileges).
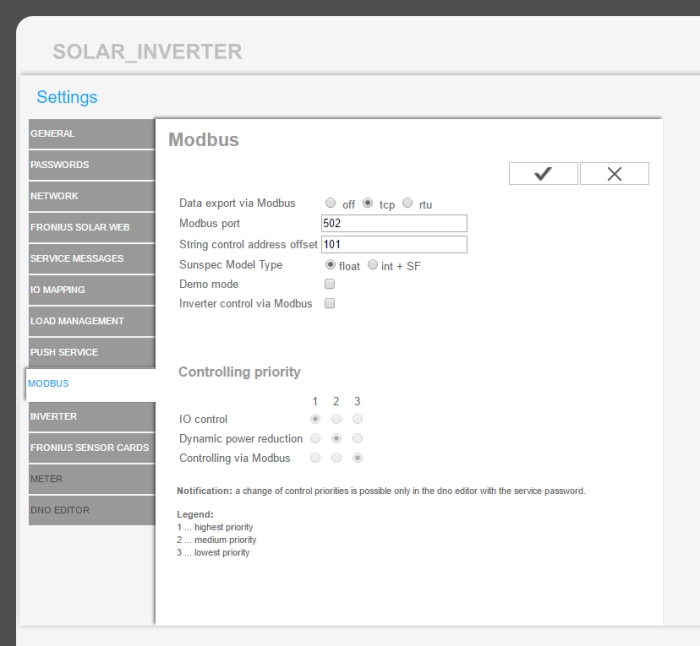
“Data export via Modbus” needs to be set to “tcp”, and a Modbus port needs to be set. I used a non-standard port for increased security. The “Sunspec Model Type” needs to be “float”. I used float as this meant there is a much larger range of numbers allowed (however some sunspec data is still “integer + scaling factor”). I also turned off “Inverter control via Modbus”, again for security.
Ideally the inverter should have a static IP address, but if using DHCP, try to make sure it always gives the inverter the same address, otherwise the script may stop working when the IP address changes.
Basic setup of the web viewer (PHP and Apache httpd) will be in another post.
I’ve been using the script for about three weeks now, and have found a few quirks. The first quirk was caused by my computer re-syncing to network time. This caused the data sampling to occur a few seconds before when it was intended to sample, and thus it over sampled. I looked into this a bit more thoroughly, and came to the conclusion, that the script can oversample, but never undersample!
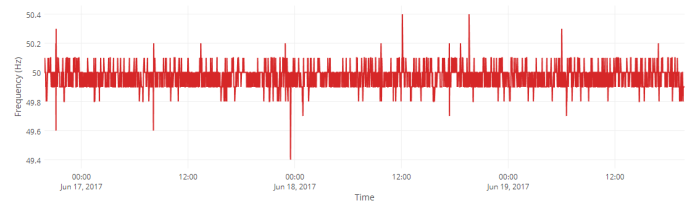
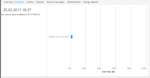
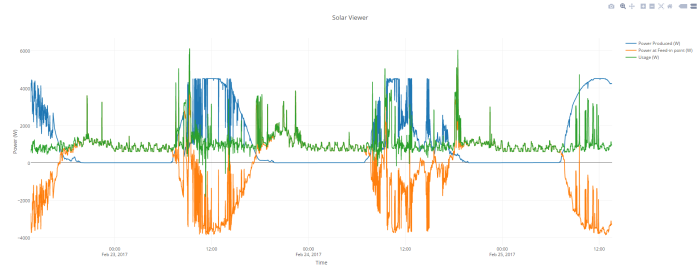
The next quirk, is more a comparison. The modbus data is instantaneous, not averaged over a period of time (example, such as since the last reading). This has lead to two tibits. The first being that in the time for the script to sample production power and feed-in power, there can be enough of a difference (if cloudy) that when usage is calculated by the sum, it can come out negative. Secondly, when the data is compared to that on SolarWeb (using the same interval), the data can be seemingly quite different. I’m not sure if this is simply just slight timing differences, or if SolarWeb is doing some kind of moving average.

Solar Web Data

Captured Data
Other things I’ve noticed while testing, which has been done on both a Windows 10 computer and another running CentOS 7 Linux,
- I could not get the logging functionality to connect to the database when the database was not already connected (that was even with a checking test and then if not open, try to open). This is my main reason for moving to SQLAlchamy.
- When trying to test graceful exit on Windows, taskkill.exe refused to gracefully kill unless used a force kill (SIGKILL), which I can’t handle in Python.
The web viewer is the part of the system that I actually wanted from the get-go, but obviously needs data to work, hence the script. I’m going to write up a separate post for the viewer, as its currently still in development. However here is my intention for it.
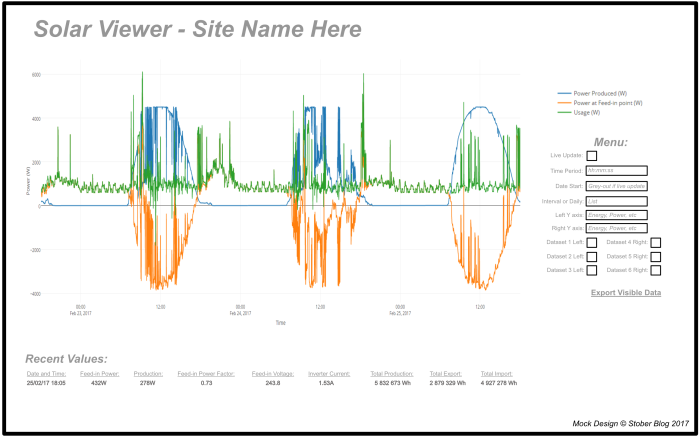
The above image, shows my draft mock-up of how the end page will look. The webpage itself, will be mostly javascript, using plotly.js to display the graph of the data. I decided on plotly.js, as it has the ability to interact with the plot – hover to get values, zoom etc, which most of the other javascript plotting engines didn’t seem to support. The data will be extracted from the database using a simple PHP script which outputs the data in CSV format.
As the mock image shows, the viewer will have the ability to change what data is shown dynamically, to automatically update, and the time of the data shown can be changed. I’m trying to also think of a way to implement having two plots above/below each other, so you can compare two time periods (such as winter and summer). I’m also toying with the idea of having the ability to save how the session has been set up (as in data shown), so next time the viewer is opened, it uses these same settings.
Well that’s finally the end of this post. I’ll link below future updates, such as the web viewer and changing to SQLAlchamy.